S&P 500 closed Monday 7/28 at 6390, up 0.02% for the day, and up 8.6% year-to-date [View all]
Last edited Mon Jul 28, 2025, 07:21 PM - Edit history (130)
Year to date is from the Dec 31 closing level.
Stock market today: S&P 500, Nasdaq eke out records as markets kick off huge week for US economy, Yahoo Finance, 7/28/25
https://finance.yahoo.com/news/live/stock-market-today-sp-500-nasdaq-eke-out-records-as-markets-kick-off-huge-week-for-us-economy-200500414.html
US stocks eked out records Monday in relatively muted trading the US and European Union struck a trade pact. The market action kicked off a packed week of Big Tech earnings, a Federal Reserve meeting, inflation data, the July jobs report, and President Trump's Aug. 1 deadline to lock in key trade deals.
The Dow Jones Industrial Average (^DJI) slipped 0.2%.
... hopes are rising for US-China talks in Stockholm, which could reportedly extend the existing tariff truce by three months beyond its current Aug. 12 deadline.
... with more than 150 S&P 500 companies set to report. Meta Platforms (META) and Microsoft (MSFT) lead off Wednesday, followed by Amazon (AMZN) and Apple (AAPL) on Thursday.
On the data front, inflation and labor will be in the spotlight. The July reading of the personal consumption expenditures (PCE) index, the Fed’s preferred inflation gauge, is forecast to show a modest monthly and annual uptick on its release on Thursday. ((I've seen economists' expectations of 0.3% May to June increases for both the regular and the core measures -- these are about 3.6% annualized -- these are not modest -Progree)).
Also on deck: a flurry of jobs data, with Friday's crucial jobs report the highlight.
========================================================
On Wednesday the ADP reports its private sector payroll numbers - their payrolls cover about 20% of the workforce. How the heck they extrapolate the other 80%, I have no idea, but it is universally considered not as comprehensive as the Bureau of Labor Statistics jobs report due out Friday.
I hope and I pray that my fellow DUers just ignore the ADP report rather than making a big hoo hah about it if it matches our ideological proclivities, as happened last time. The ADP and BLS are very often far apart in both directions. If you are going to Krasnov, Krasnov, Krasnov the Friday numbers, at least be consistent -- don't ghost us when government numbers come in poor as they often do, e.g. the May retail sales disaster, and the weak May BLS jobs report -- with 95k of downward revisions of prior months, there were only 44k more jobs than reported a month before that.
Another example: the PPI wholesale prices for June came out with essentially zero inflation, and the Krasnov Krasnov brigade was all over it. But the previous day, the CPI (consumer prices) report for June came out showing quite an uptick in inflation and it was taken as proof that tariffs and immigrant labor shortages were driving up inflation. Nowhere was there a suggestion that the CPI numbers were manipulated. The PPI and CPI reports are both produced by the BLS.
=============================================
The S&P 500 closed Monday July 28 at 6390, up 0.02% for the day,
and up 10.5% from the 5783 election day closing level,
and up 6.5% from the inauguration eve closing level,
and up 8.6% year-to-date,
S&P 500
# Election day close (11/5/24) 5783
# Last close before inauguration day: (1/17/25): 5997
# 2024 year-end close (12/31/24): 5882
# All-time closing high (2/19/25): 6144, until 6/27/25 when it closed at 6173
. . . With the new all-time high closing on June 27, we are in a bull market by any and all definitions
# Trump II era low point (going all the way back to election day Nov5): 4983 on April 8
# Several market indexes: https://finance.yahoo.com/
# S&P 500: https://finance.yahoo.com/quote/%5EGSPC/
https://finance.yahoo.com/quote/%5EGSPC/history/
========================================================
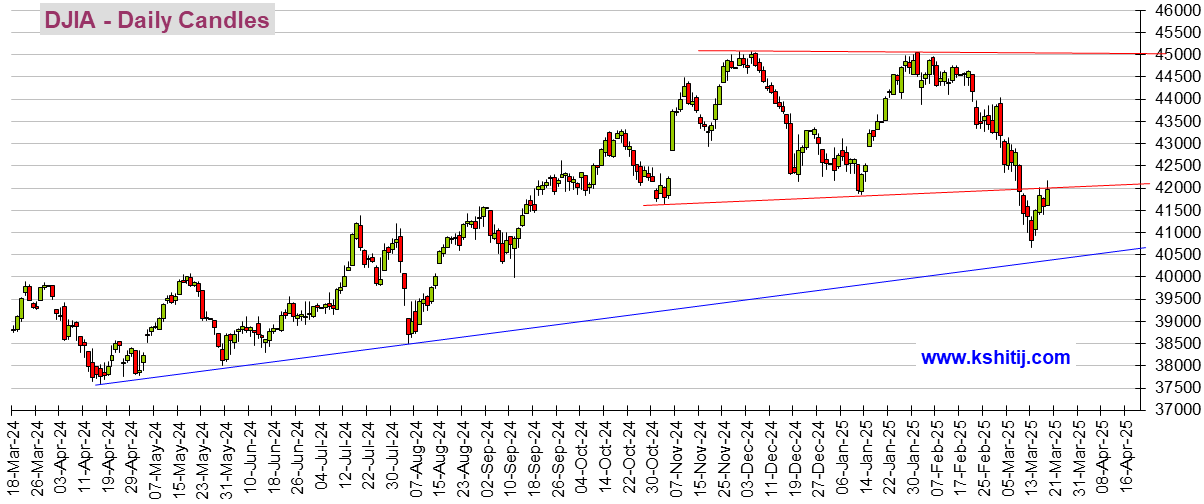
I'm not a fan of the DOW as it is a cherry-picked collection of just 30 stocks that are price-weighted, which is silly. But since there is an automatically updating embedded graphic, here it is. It takes several, like 6 hours, after the close for it to update, like about 10 PM EDT.
(If it still isn't updated, try right-clicking on it and opening in a new tab. #OR# click on https://finance.yahoo.com/quote/%5EDJI/ ).
The Dow closed Friday at 44,902, and it closed Monday at 44,838, a drop of 0.1% (64 points) for the day
It closed Wednesday just 4 points below its 45,014 all-time high set in December. But now it's 176 points away from that.
I don't maintain statistics for the DOW like percent up or down since election day, or year-to-date, or from the all-time high etc. like I do for the S&P 500.
DJIA means Dow Jones Industrials Average. It takes about 6 hours after the close to update, so check it after 10 PM EDT
https://finance.yahoo.com/
DOW: https://finance.yahoo.com/quote/%5EDJI/
. . . . . . https://finance.yahoo.com/quote/%5EDJI/history/
DOW
# Election day close (11/5/24) 42,222
# Last close before inauguration day: (1/17/25): 43,488
# 2024 year-end close (12/31/24): 42,544
# DOW All Time High: 12/4/24: 45,014
# Correction level beginning 10% down: 40,513,
# Bear market level: beginning 20% down: 36,011 (we've not reached that level yet in Trump II so far)
I don't have an embeddable graph for the S&P 500, unfortunately, but to see its graph, click on https://finance.yahoo.com/quote/%5EGSPC/
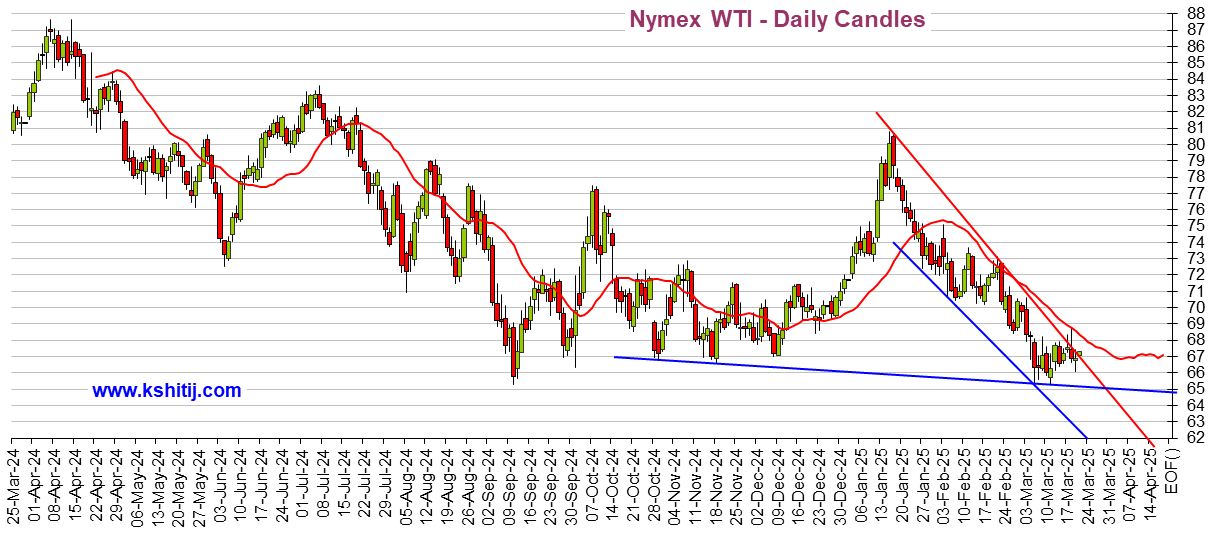
While I'm at it, I might as well show Oil and the Dollar:
Crude Oil
US Dollar Index (DX-Y.NYB)
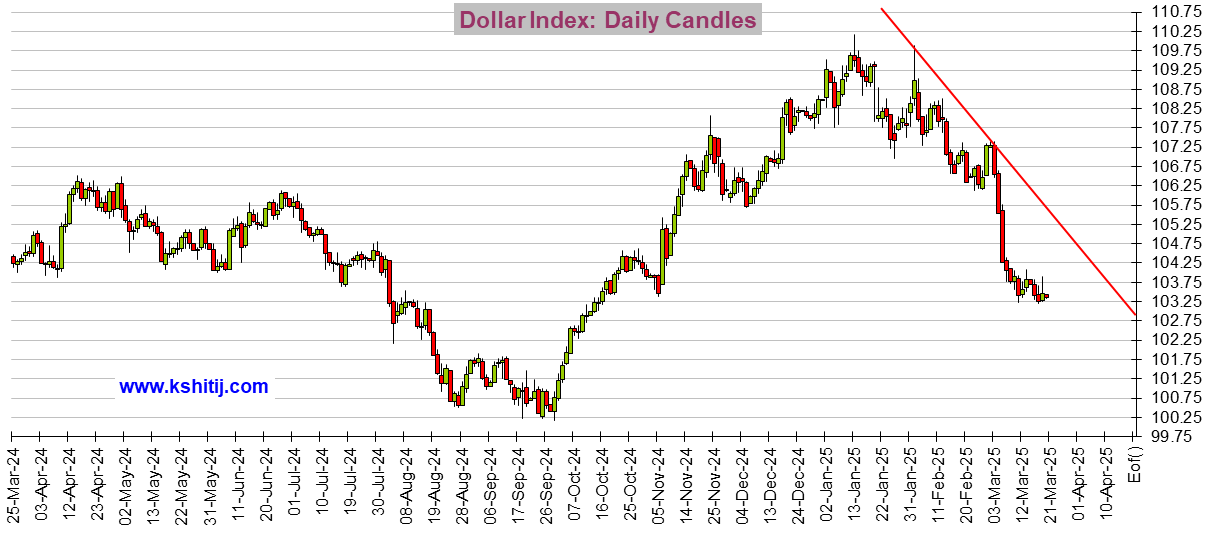
If you see a tiny graphics square above and no graph, right click on the square and choose "load image". There should be a total of 3 graphs. And remember that it typically takes about 6 hours after the close before these graphs update.
 = new reply since forum marked as read
Highlight:
NoneDon't highlight anything
5 newestHighlight 5 most recent replies
= new reply since forum marked as read
Highlight:
NoneDon't highlight anything
5 newestHighlight 5 most recent replies