Economy
Related: About this forumMarket metrics thru 7/2 - stock indexes, treasury yields, and gold, silver, and oil over the past 4 weeks
Last edited Mon Jul 6, 2026, 04:39 AM - Edit history (15)
building on Lastlib's every Friday market metrics in Personal Finance and Investing Group
Thursday July 2 is the last day of the market week because markets were closed Friday July 3 for 4th of July Weekend.
Percent changes Last 7 days and last 4 weeks (since June 5)

The yield changes are the percentage points differences,
e.g. if some Treasury went from 3.61% to 3.66% over the past week. then that is a change of +0.05%
Red numbers in ()'s are negative numbers, meaning the metric went down.
Treasury notes' yields up means the notes' values are down
as likely people's bond portfolios
All time closing highs --
S&P 500: 7609.78 on 6/2
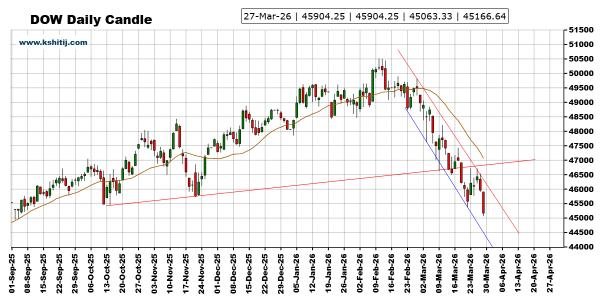
DOW: 50,188 on February 10, and then in May, June, and July has been lately setting frequent new all time highs. The 7/2 value shown, 52,900, is a new all-time high
For a 6- to 9-month perspective, depending on which graph, I like pasting these in because the automatically update. I wish I had one for the S&P 500, but I don't, oh well.
Total Real Returns ("real" means inflation-adjusted. You can also set it to nominal dollars)
https://totalrealreturns.com/
# Total returns includes reinvested dividends. I don't see a price-only option.
# I don't see one for indexes like the S&P 500. Instead one must pick an index fund such as SPY (an ETF) or VFIAX (a mutual fund). I prefer the latter for this purpose because mutual funds are priced at NAV (net asset value) at the end of the day, so you don't have varying discounts and premiums like you have with ETFs.
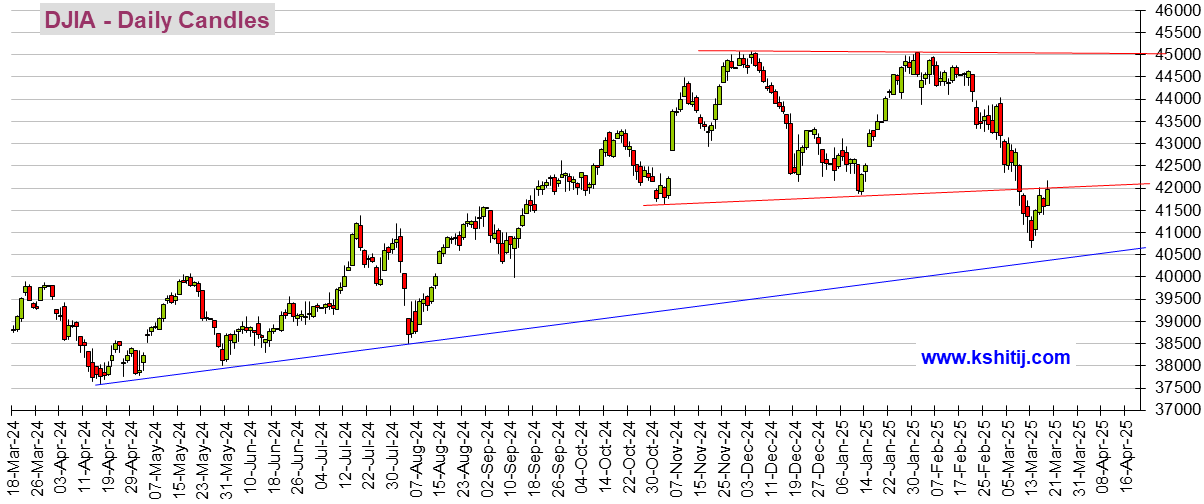
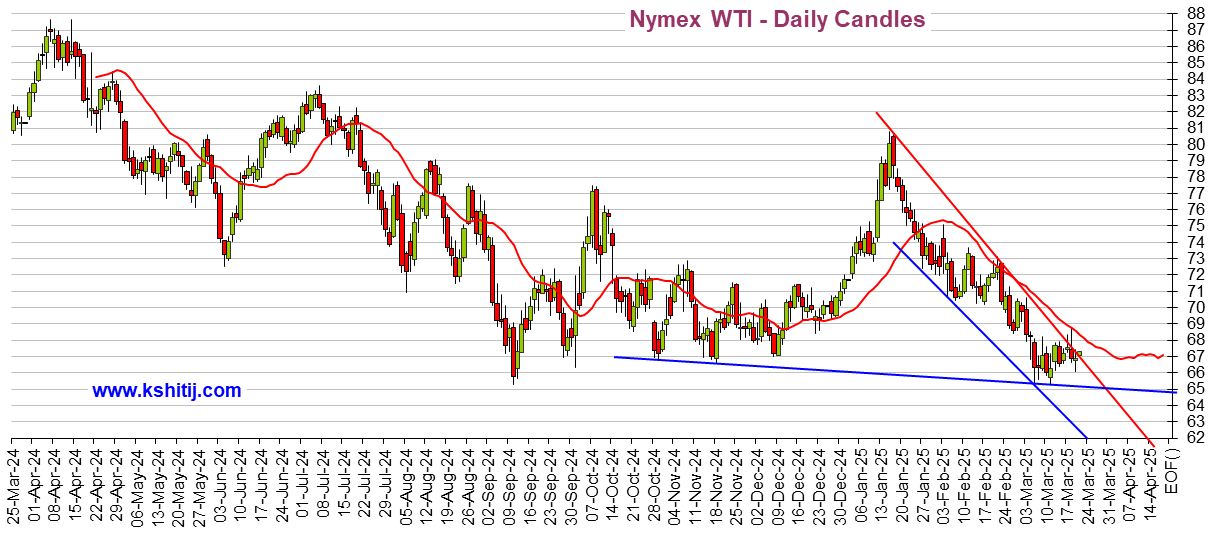
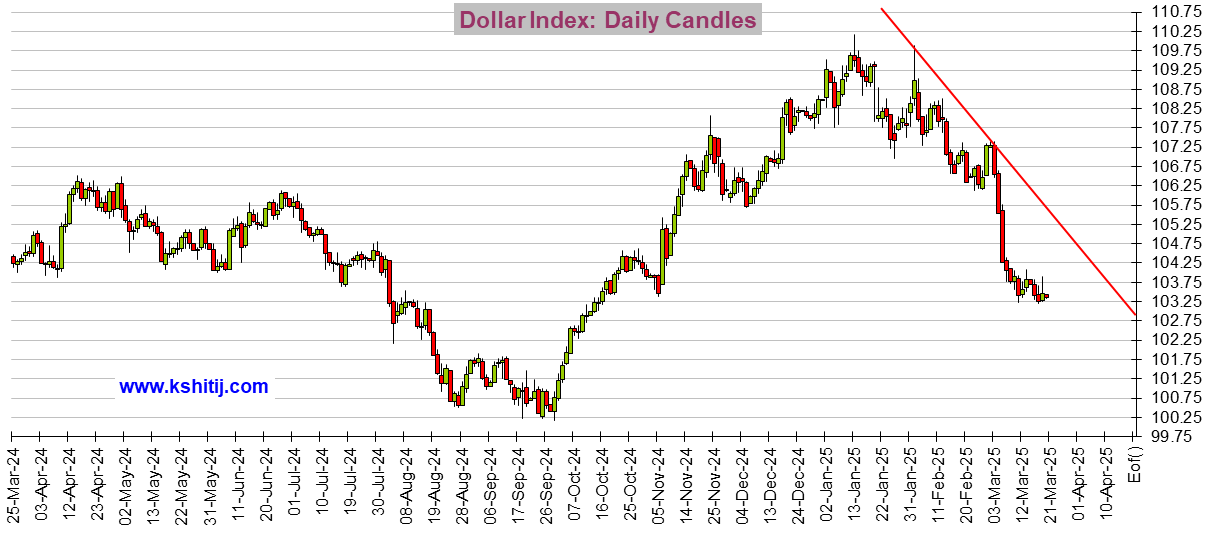
Dow, Oil, and Dollar (last several months) - they update a few hours (like about 6 hours) after the close
The attacks on Iran began on February 28.
Dow 30,
3/28 3:04 PM ET - I don't know why the big one hadn't updated so I added the little version which was more up-to-date
https://kshitij.com/graph-gallery/equities/dowjones-candles-Daily
 ?0.5749081749552942
Crude Oil
US Dollar Index (DX-Y.NYB)
The graphs above update automatically. So they are up-to-date a few hours after each close (usually).
There should be 4 graphs above. If you see little image squares and no graphs, right click on each such image square and choose Load Image.
 = new reply since forum marked as read
Highlight:
NoneDon't highlight anything
5 newestHighlight 5 most recent replies
= new reply since forum marked as read
Highlight:
NoneDon't highlight anything
5 newestHighlight 5 most recent replies

bucolic_frolic
(56,465 posts)Many of course focus on precious metals, commodities, MAG7, crypto .......... so don't take my guru's opinions for anything other than awareness of someone's perspective ......
I've been following this guy since 2012 when he had a website called In the Money Stocks. He's a sound technician
And I like this economist, though he's skeptical of all US parties at various points, but this one is worth the listen just for his idea there will be in regime change .... in the US!
&t=1203s

progree
(13,125 posts)I will produce a version similar to the OP above when I get done with the Friday update of the S&P 500 thing
progree
(13,125 posts)progree
(13,125 posts)progree
(13,125 posts)progree
(13,125 posts)progree
(13,125 posts)progree
(13,125 posts)progree
(13,125 posts)progree
(13,125 posts)